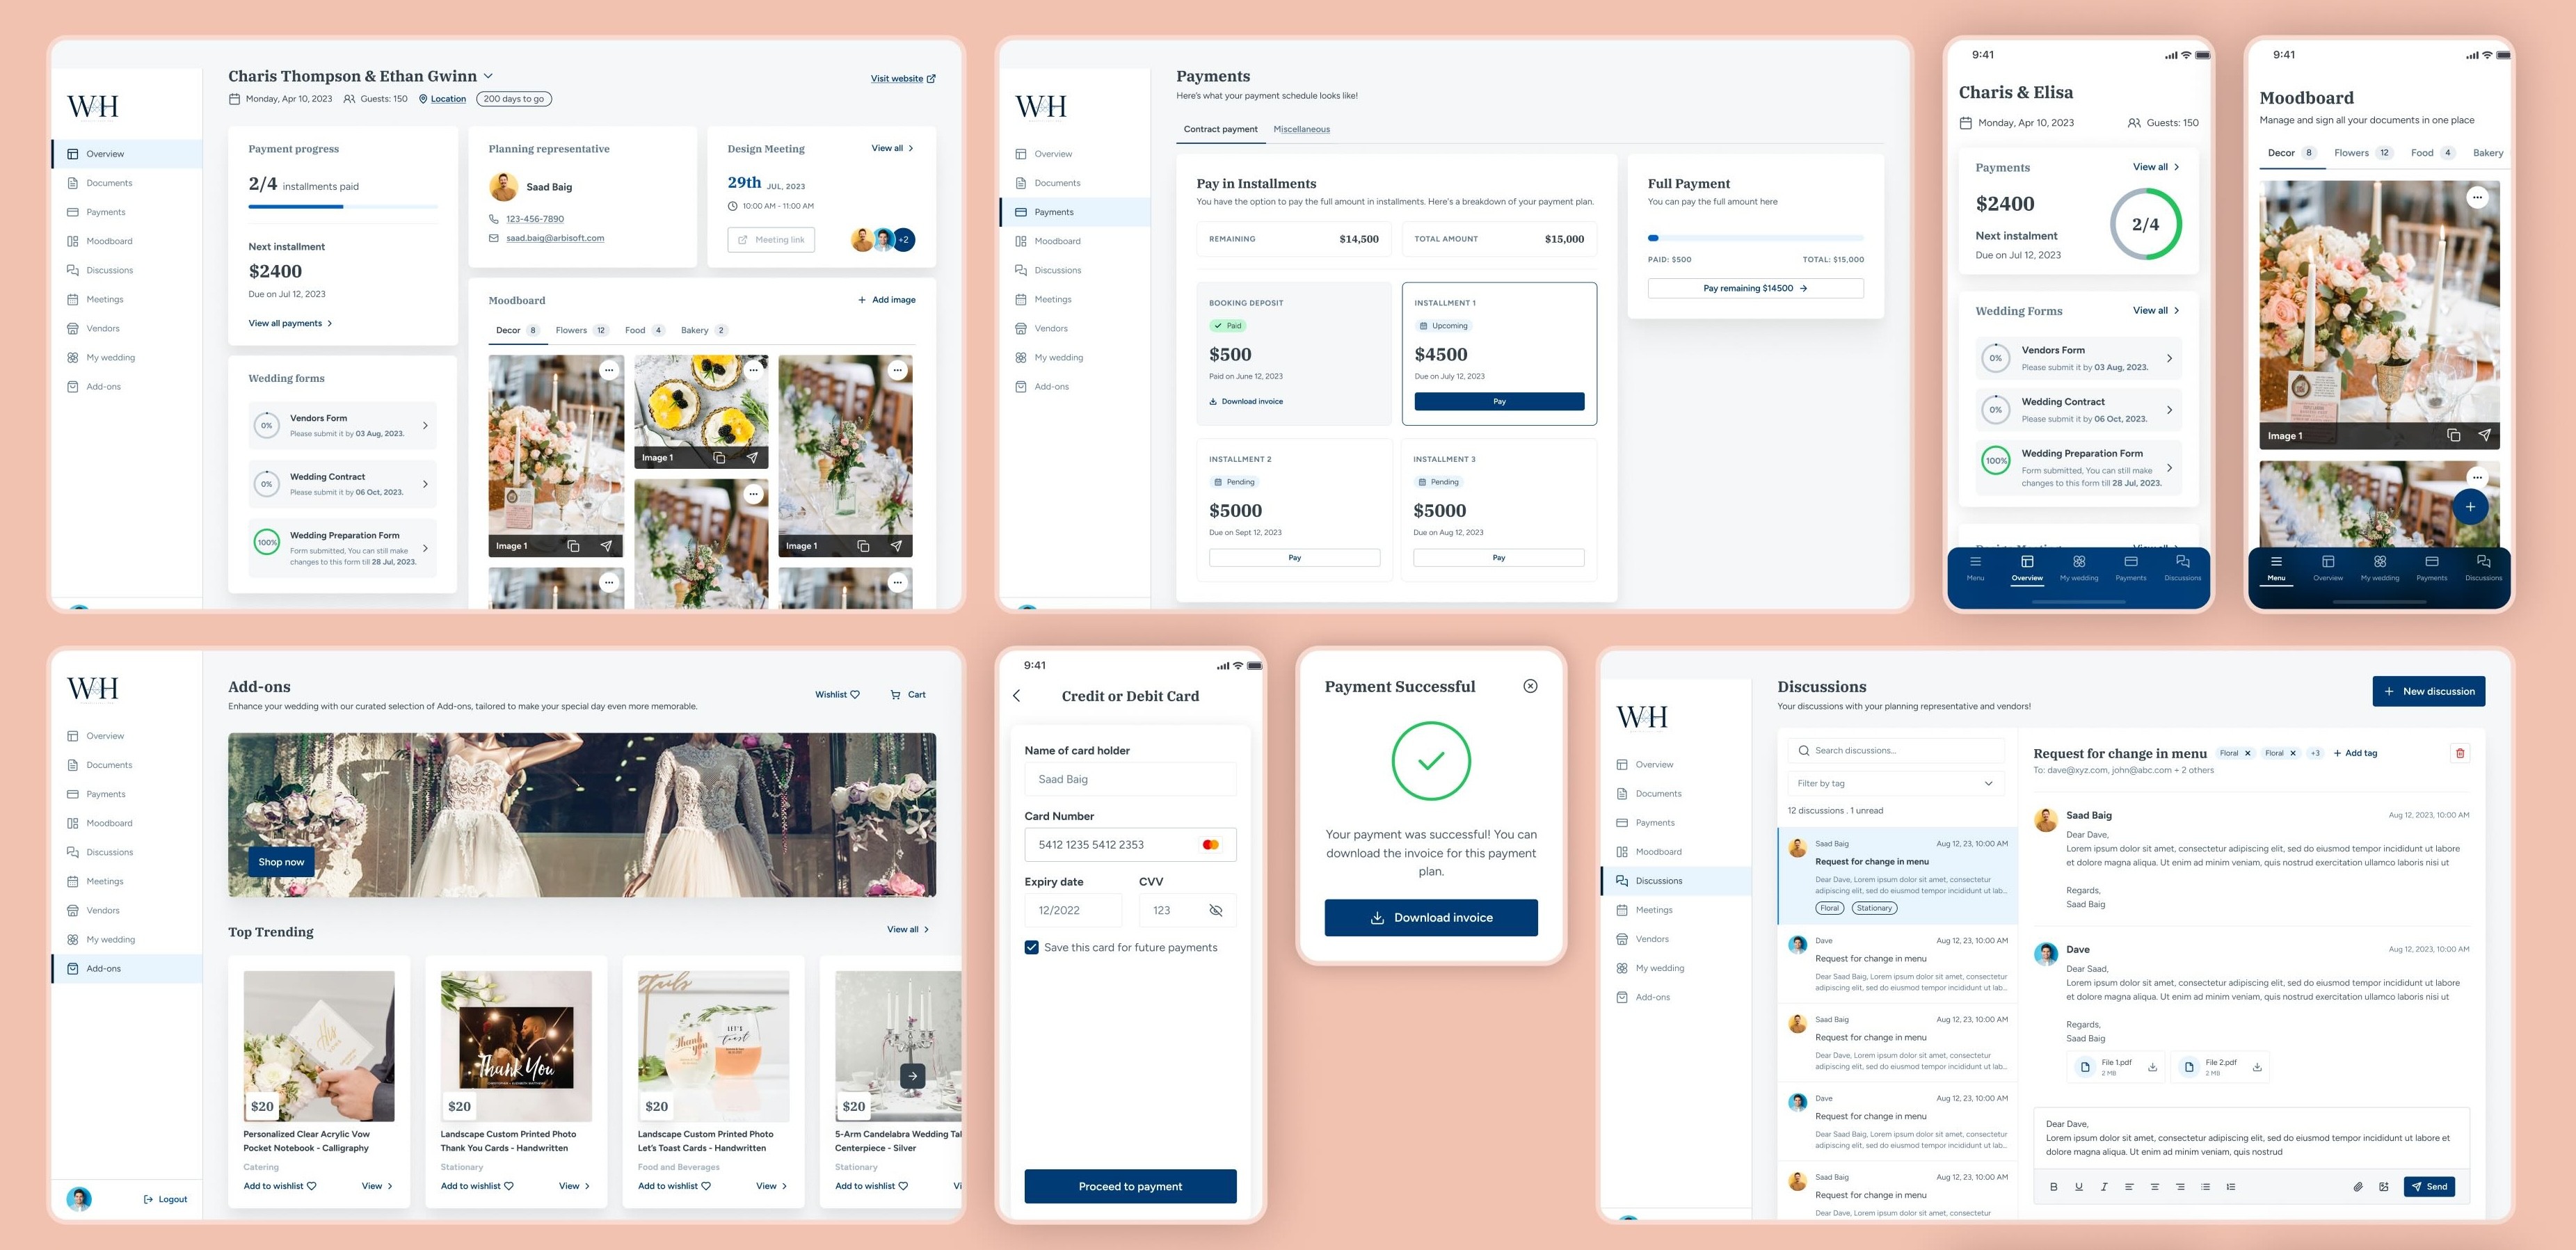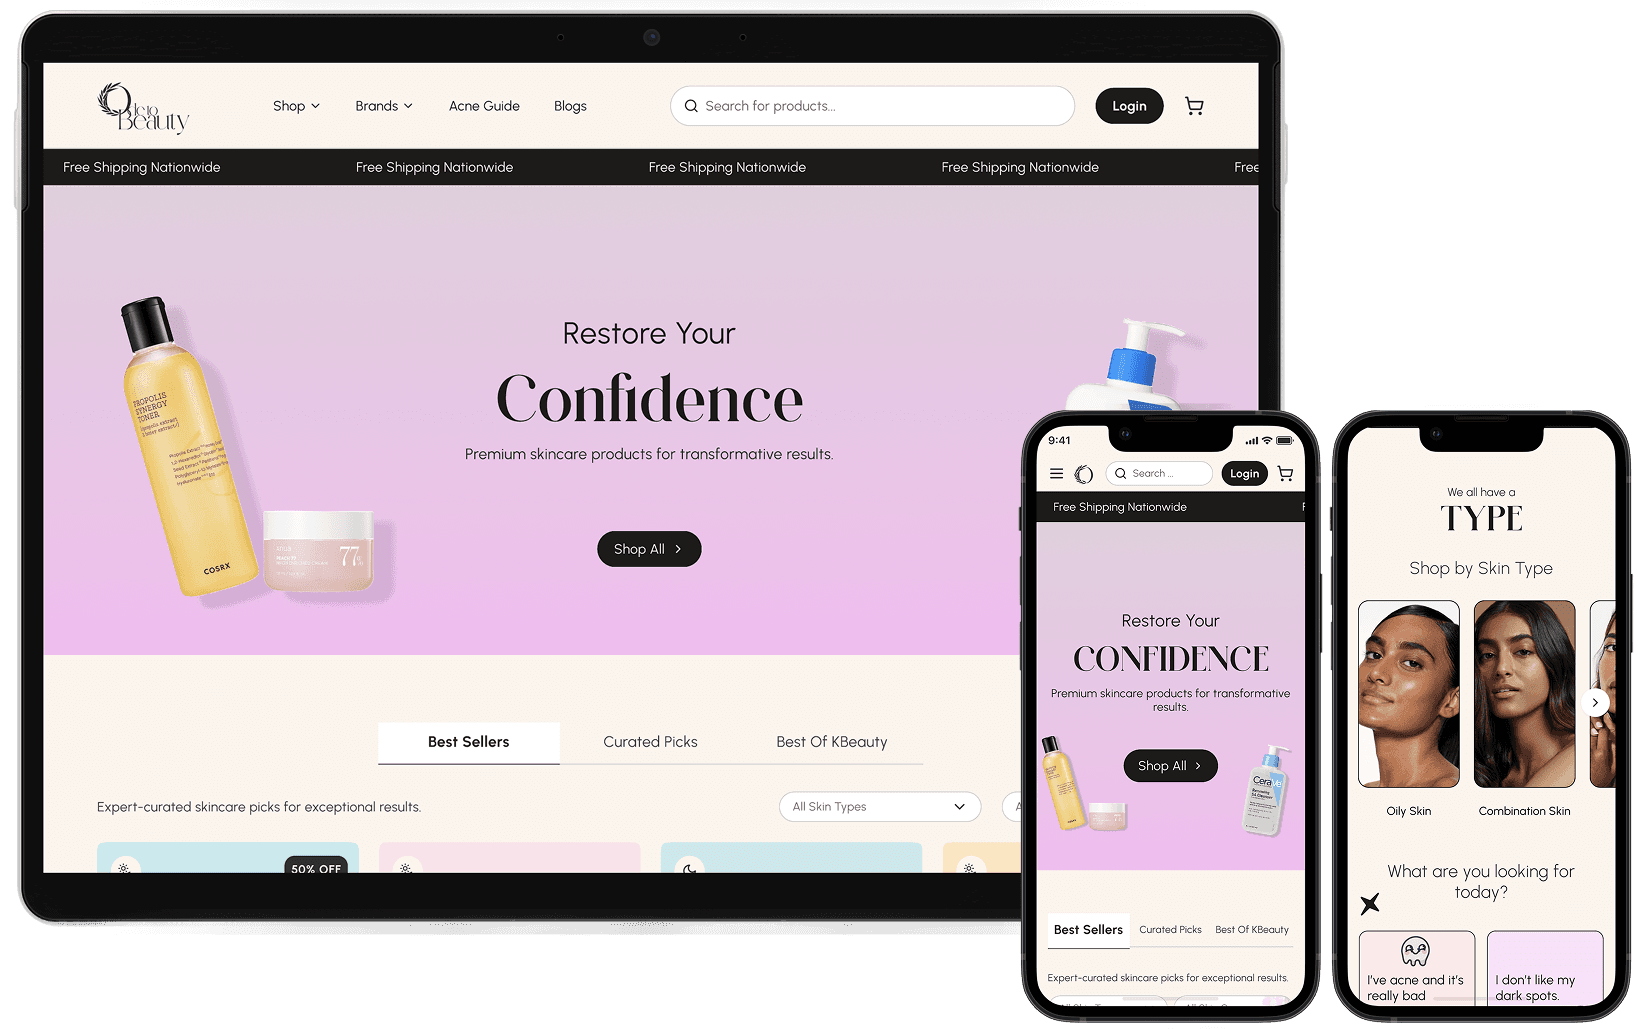
Ode to Beauty
Turning a skincare marketplace into a real brand — task completion up from 27% to 100%.
E-commerce
Earn the discount. Don't just take it.


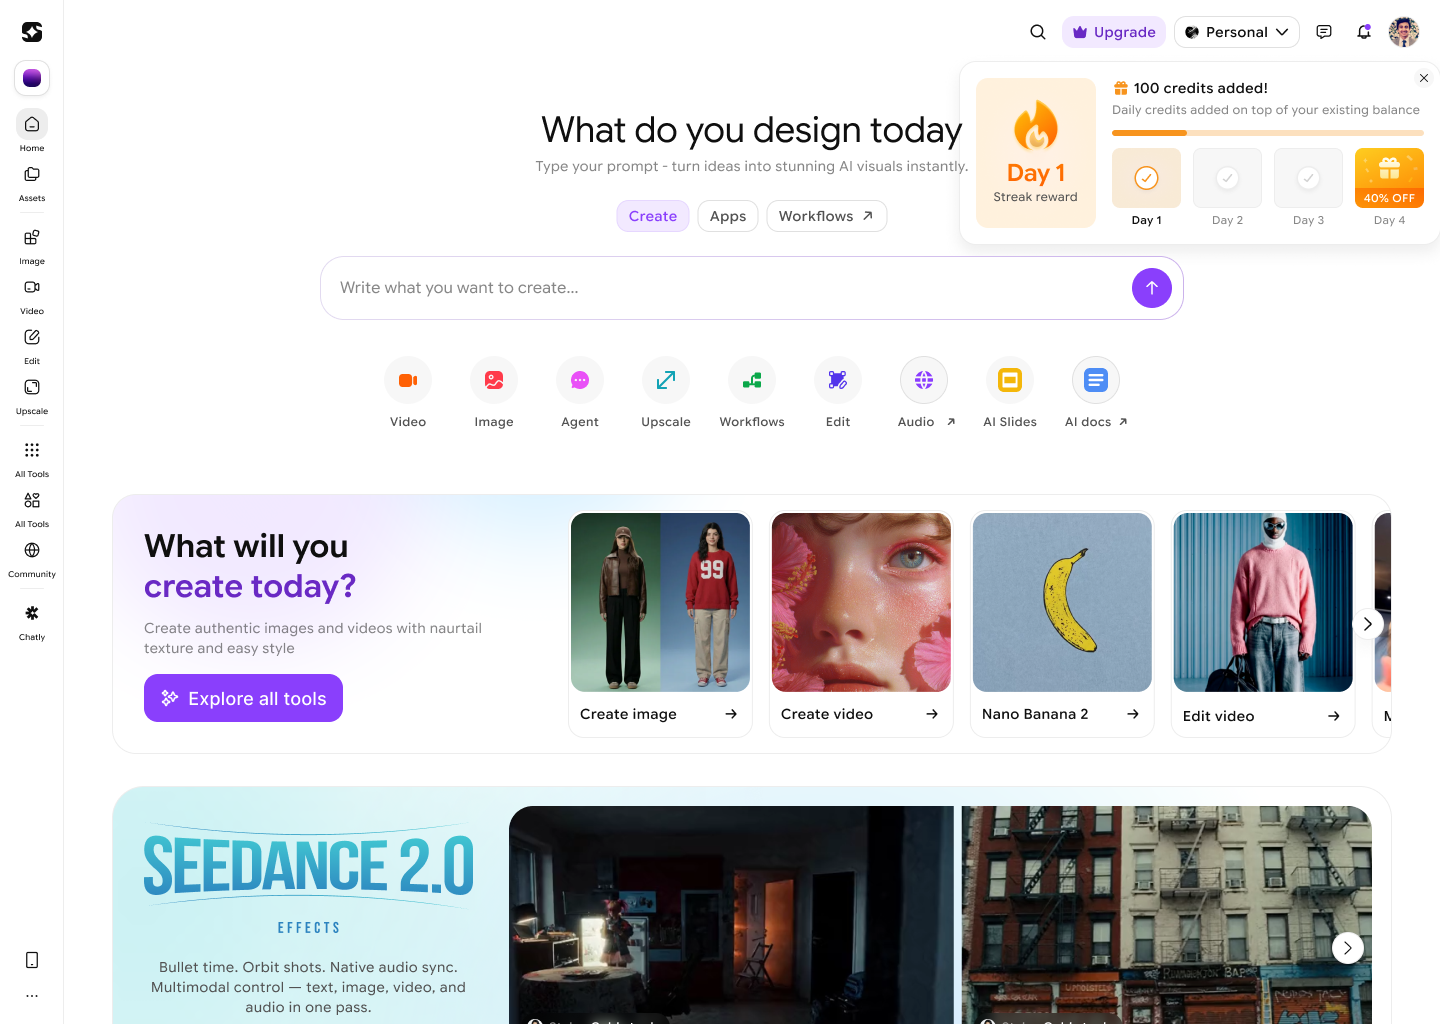
Day 1
Streak reward

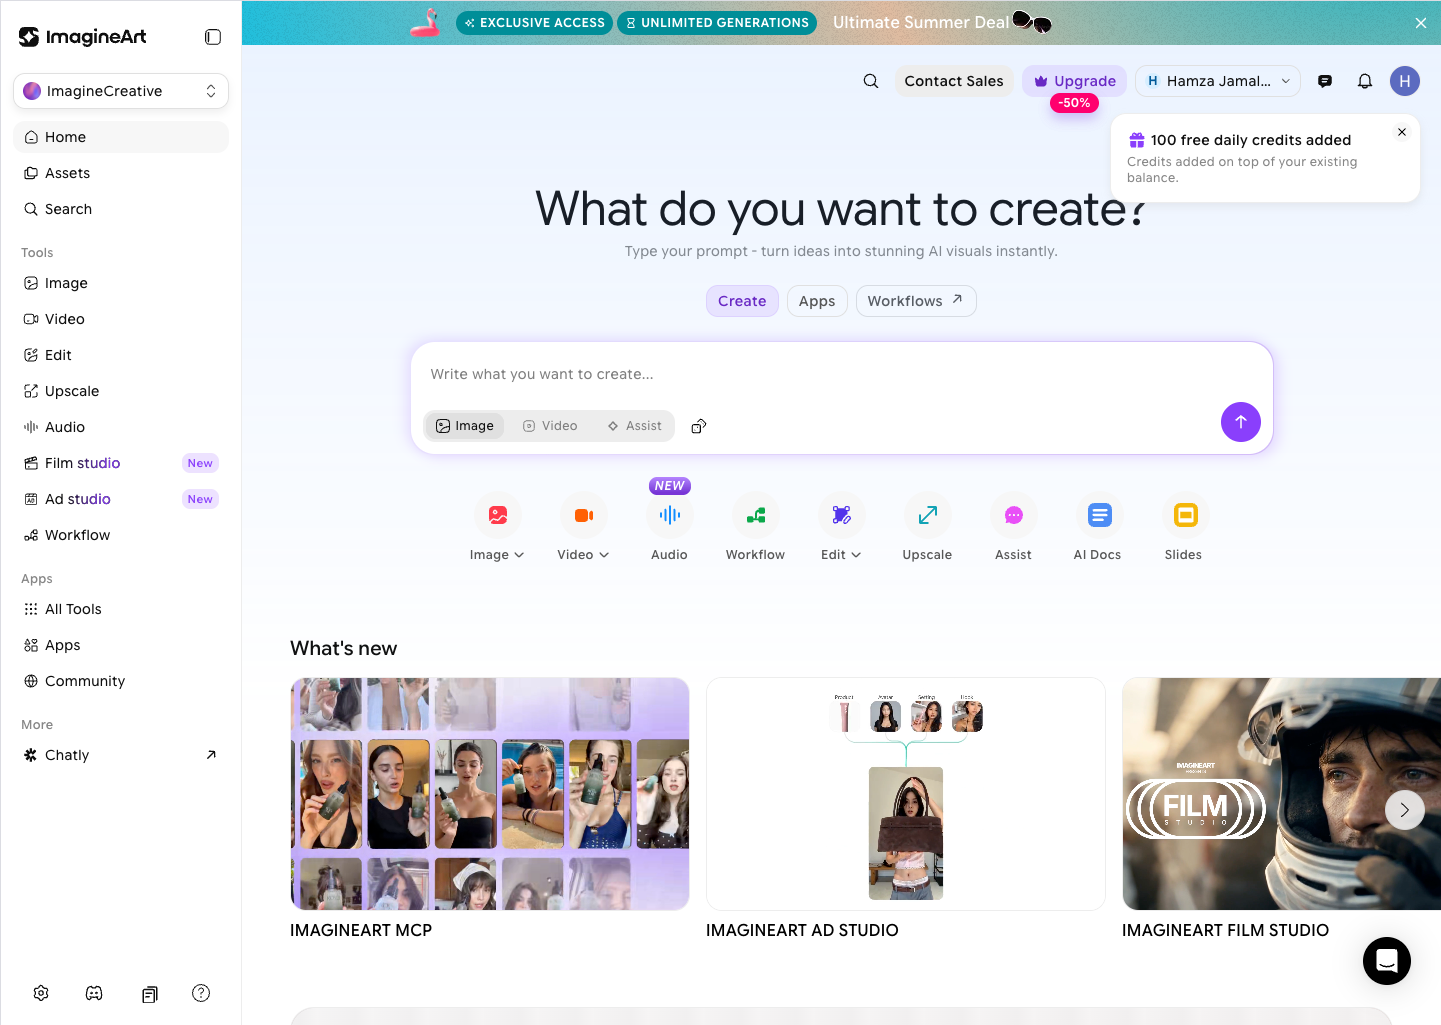
100 credits added!
Daily credits added on top of your existing balance


40% OFF
01/The problem
ImagineArt gives free users 100 credits a day. People came back, used them, and left. They rarely converted.
A daily discount was running in parallel and was ignored. A discount that is always there stops being an offer. The bet became simple. Keep the same incentive. Make the user feel they earned it.
02/The core decision
The length was the highest-leverage decision. Get it wrong and we either fail to build a habit, or train users to wait.
Three days
rejected
A user who wanted to subscribe today could just wait three days for a cheaper deal. We would have been teaching the entire base to delay purchase.
Seven days
too ambitious
A week is a long commitment for a behaviour that has not been built yet. Drop-off compounds, and every extra day is another chance for a user to break the chain before they have any reason to care about it.
Four days
won
Long enough to require intent. Short enough that completion feels achievable inside one work week. The midpoint, day two, is where streaks usually die, and four is short enough that we never sit on the midpoint for long.
03/Why a streak works at all
A streak is doing three quiet things to a user at the same time. None of them are obvious. That is the point.
Hyperbolic discounting. Users value near-term rewards far more than distant ones. Four days sits inside the near-term window where the reward still feels real.
Goal-gradient effect. Motivation rises as the goal gets closer. Four days keeps the user inside that gradient the whole time. Day three feels inevitable rather than optional.
Loss aversion. A streak you have already invested in feels valuable. The counter becomes an asset the user does not want to lose. The same 100 credits, now anchored to a sunk cost.
04/Before and after
The same 100 credits. Reframed.
05/Visual decisions
Orange is high-arousal but warm. Red would read as a warning, yellow as a caution. Orange holds the middle, and it's already ImagineArt's brand colour.
The flame was a non-decision. Streaks already have a universal vocabulary, from Snapchat to Duolingo. Inventing a new metaphor would have only added friction.
Day four breaks the flame pattern on purpose. A gold gift box takes its place. The visual rupture signals arrival.
06/Edge cases
07/Open question
The current design ships without a recovery flow. Miss a day and the streak resets. The 40% goes with it. Start again at day one.
A broken-streak discount would cheapen the loop. The whole point is that the reward is earned. A recovery offer is just the old daily discount with extra steps.
A streak freeze is the middle path. One free freeze a month, the way Duolingo does it. Forgiveness, not punishment. I would add it in v2 once the break rates are visible.
08/Outcome
Live on the ImagineArt home for all free users. Five metrics define whether this worked, in order of how much they tell us.
Of users active on day 1, what percentage return on day 2 to start a streak.
Of starters, what percentage reach day 4 and claim the reward.
Day 2 to 3 to 4 retention. The biggest leak typically sits between day 2 and 3.
Of users who complete, how many redeem the discount before it expires.
Retention and paid conversion of streak users versus a non-streak control, measured over thirty days.
09/Reflection
Ship the broken-streak experience in v1. We left a hole users will discover before our metrics do.
A/B test the length from the start. Three days versus four. The case for four is strong on paper, but paper is not data. Testing is cheaper than winning the argument.
Design what happens after day four. Right now the loop ends. Users who complete should re-enter the funnel toward a bigger reward at day fourteen or thirty.